* [lttng-dev] Need Help In trace generation for malloc(), free() calls etc
       [not found] <CAPC3ern8bkAJDnOwoYh2Om44Q2GWAPsh140FW_aPGVkdUmCwkw@mail.gmail.com>
@ 2020-05-13  4:59 ` Abhinav Ranjan
  2020-05-13 15:33   ` Jonathan Rajotte-Julien
  0 siblings, 1 reply; 4+ messages in thread
From: Abhinav Ranjan @ 2020-05-13  4:59 UTC (permalink / raw)


  Hello Sir,
I am Abhinav from India.
*Kindly Ignore the previous email.*
Actually I am very new to the Embedded System Engineering profession. In
fact I have been asked to do an independent project to instrumenting a c
application using  LLTng concept to find/trace calls to malloc(), free()
calls. In fact i tried capturing the same as below steps but didn't
understand why after using LD_PRELOAD also malloc() and free() calls were
not traced. I am not sure whether my app was correct!!

 I followed the steps provided to create executable using -lltng-ust -ldl
2.I executed it as: LD_PRELOAD=liblttng-ust-libc-wrapper.so ./executable
(initially as ./exe arg))
3. Then I followed commands to create , capture the events. and destroyed
it.
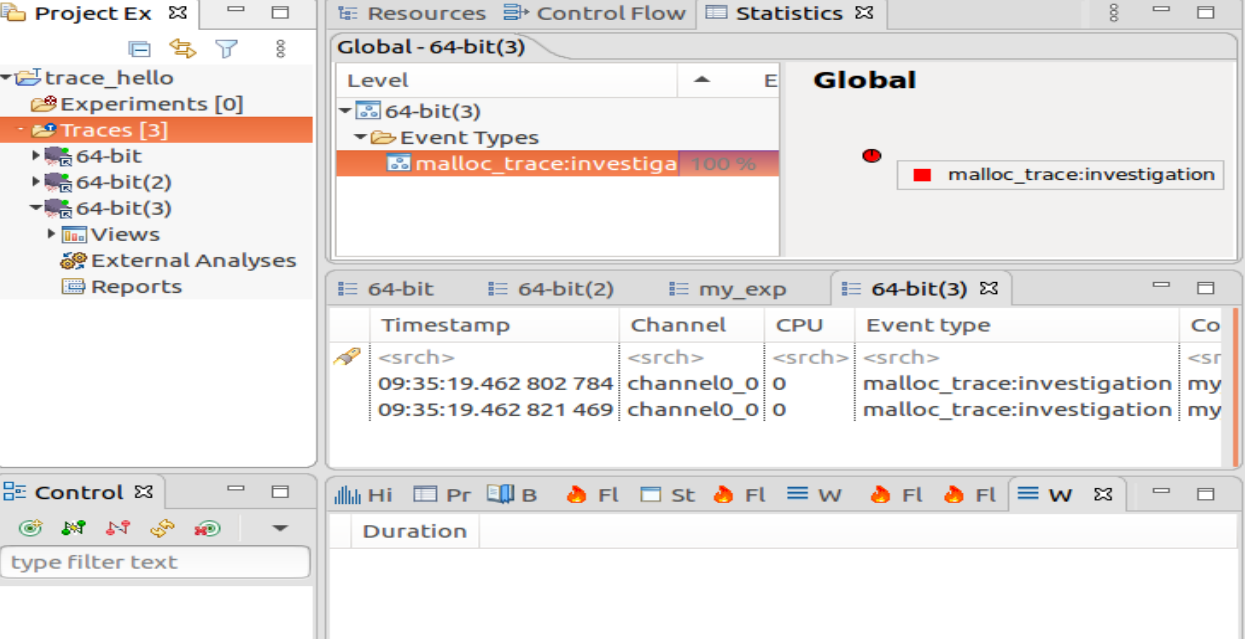
4. I used TraceCompass to analyze the trace but it did't show any call
trace to malloc or free.


Corresponding to above steps I am inserting images as below:
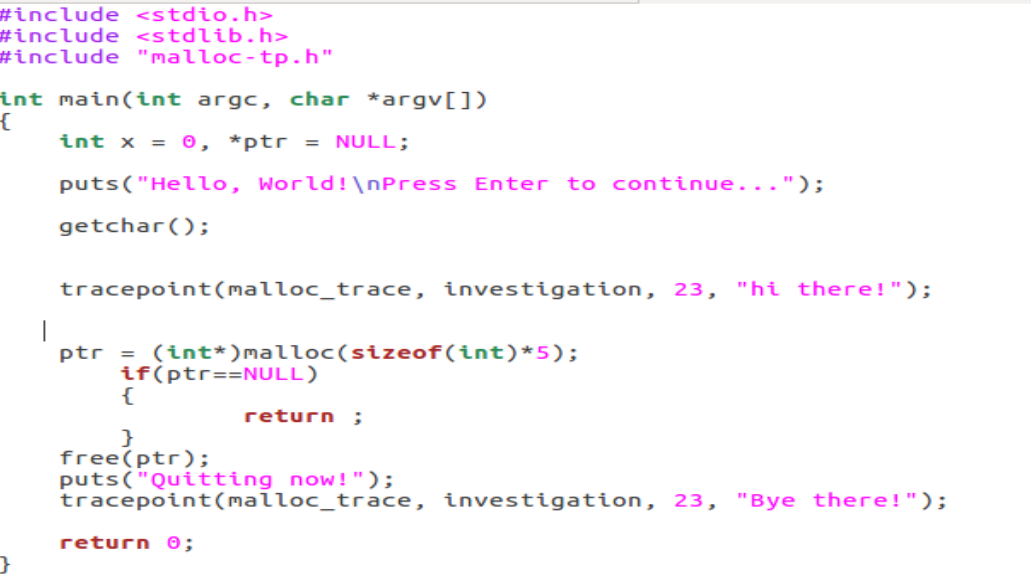
[image: 1malloc_app.PNG]
Above is malloc.c (App)
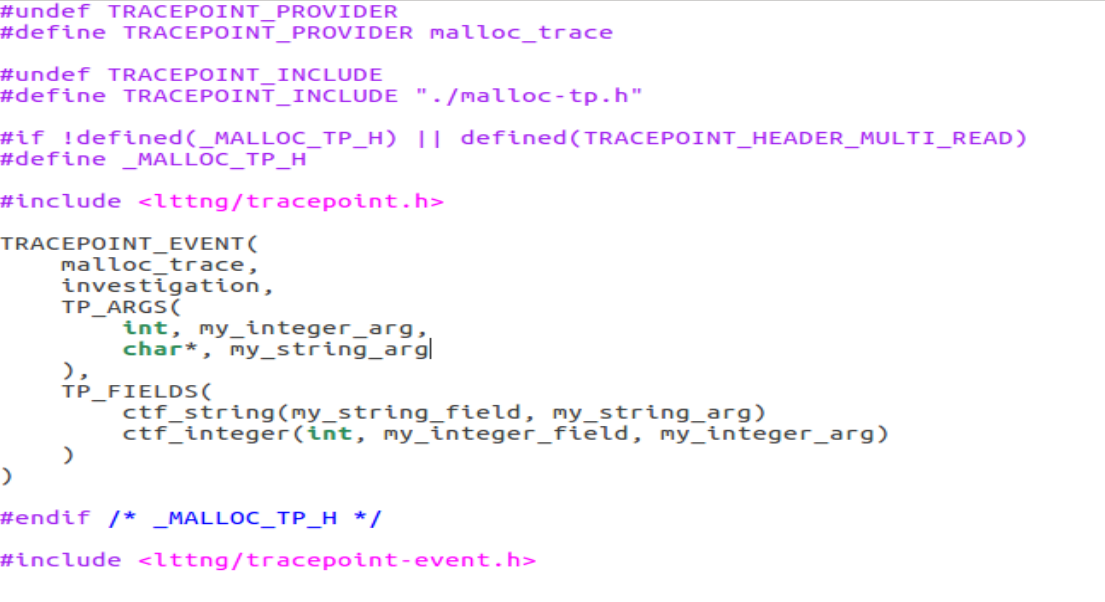
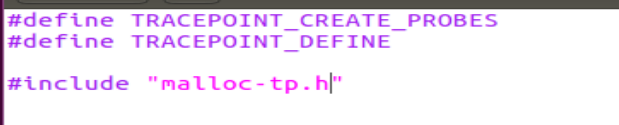
[image: 2malloc_tp.PNG]
[image: 2malloc_tp.PNG]
[image: 4.exectable.PNG]
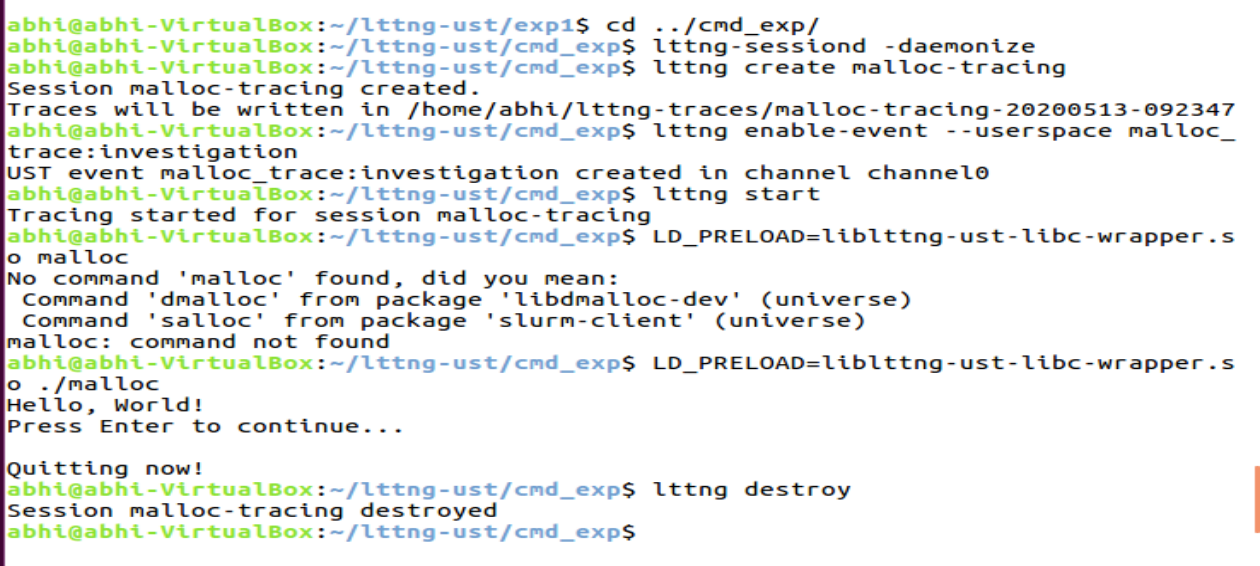
[image: 5.trace_creation.PNG]

But trace was not showing the malloc call and free call event then
alternatively i did the following:

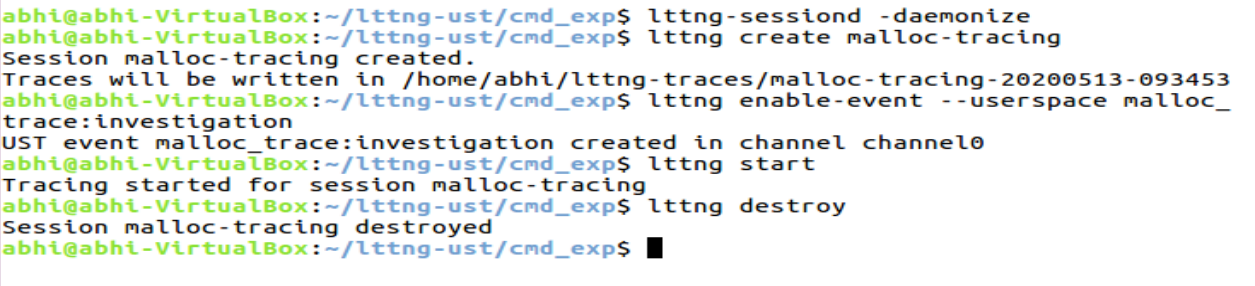
[image: 6.alternativeto5.PNG]
in different tab the following steps: after trace start i pressed enter in
other tab to execute the app. then used lttng destroy.
[image: 7.creation_trace.PNG].
[image: 8.tracecompass.PNG]

On Wed, 13 May 2020 at 10:10, Abhinav Ranjan <abhi.abhinav240 at gmail.com>
wrote:

> Hello Sir,
> I am Abhinav from India.
> Actually I am very new to the Embedded System Engineering profession. In
> fact I have been asked to do an independent project to instrumenting a c
> application using  LLTng concept to find/trace calls to malloc(), free()
> calls.
>
> 1. I followed the steps provided to create executable using
> -lltng-ust -ldl
> 2.I executed it as: LD_PRELOAD=liblttng-ust-libc-wrapper.so ./executable
> 3. Then I followed commands create , capture the events. and destroyed it.
> 4. I used TraceCompass to analyze the trace but it won't show any calls to
> malloc or free.
>
> Please help i want to trace the malloc(),free() calls in the application.
> Corresponding to above steps I am inserting images as below:
> [image: 1malloc_app.PNG]
> [image: 2malloc_tp.PNG]
> [image: 3malloc-tp_header.PNG]
> [image: 4.exectable.PNG]
> [image: 5.trace_creation.PNG]
>
> But trace was not showing the malloc call and free call event then
> alternatively i did the following:
>
> [image: 6.alternativeto5.PNG]
> [image: 7.creation_trace.PNG]
> [image: 8.tracecompass.PNG]
>
> Thanking You!
>
> Regards,
> Abhinav
> 9482866639
>
>

--
Thanking You!

Regards,
Abhinav
-------------- next part --------------
An HTML attachment was scrubbed...
URL: <https://lists.lttng.org/pipermail/lttng-dev/attachments/20200513/2cf7eeb1/attachment-0001.htm>
-------------- next part --------------
A non-text attachment was scrubbed...
Name: 1malloc_app.PNG
Type: image/png
Size: 141143 bytes
Desc: not available
URL: <https://lists.lttng.org/pipermail/lttng-dev/attachments/20200513/2cf7eeb1/attachment-0009.png>
-------------- next part --------------
A non-text attachment was scrubbed...
Name: 2malloc_tp.PNG
Type: image/png
Size: 186135 bytes
Desc: not available
URL: <https://lists.lttng.org/pipermail/lttng-dev/attachments/20200513/2cf7eeb1/attachment-0010.png>
-------------- next part --------------
A non-text attachment was scrubbed...
Name: 3malloc-tp_header.PNG
Type: image/png
Size: 188192 bytes
Desc: not available
URL: <https://lists.lttng.org/pipermail/lttng-dev/attachments/20200513/2cf7eeb1/attachment-0011.png>
-------------- next part --------------
A non-text attachment was scrubbed...
Name: 4.exectable.PNG
Type: image/png
Size: 54304 bytes
Desc: not available
URL: <https://lists.lttng.org/pipermail/lttng-dev/attachments/20200513/2cf7eeb1/attachment-0012.png>
-------------- next part --------------
A non-text attachment was scrubbed...
Name: 5.trace_creation.PNG
Type: image/png
Size: 449439 bytes
Desc: not available
URL: <https://lists.lttng.org/pipermail/lttng-dev/attachments/20200513/2cf7eeb1/attachment-0013.png>
-------------- next part --------------
A non-text attachment was scrubbed...
Name: 6.alternativeto5.PNG
Type: image/png
Size: 78162 bytes
Desc: not available
URL: <https://lists.lttng.org/pipermail/lttng-dev/attachments/20200513/2cf7eeb1/attachment-0014.png>
-------------- next part --------------
A non-text attachment was scrubbed...
Name: 7.creation_trace.PNG
Type: image/png
Size: 263011 bytes
Desc: not available
URL: <https://lists.lttng.org/pipermail/lttng-dev/attachments/20200513/2cf7eeb1/attachment-0015.png>
-------------- next part --------------
A non-text attachment was scrubbed...
Name: 8.tracecompass.PNG
Type: image/png
Size: 263819 bytes
Desc: not available
URL: <https://lists.lttng.org/pipermail/lttng-dev/attachments/20200513/2cf7eeb1/attachment-0016.png>
-------------- next part --------------
A non-text attachment was scrubbed...
Name: 2malloc_tp.PNG
Type: image/png
Size: 28031 bytes
Desc: not available
URL: <https://lists.lttng.org/pipermail/lttng-dev/attachments/20200513/2cf7eeb1/attachment-0017.png>


^ permalink raw reply	[flat|nested] 4+ messages in thread
* [lttng-dev] Need Help In trace generation for malloc(), free() calls etc
  2020-05-13  4:59 ` [lttng-dev] Need Help In trace generation for malloc(), free() calls etc Abhinav Ranjan
@ 2020-05-13 15:33   ` Jonathan Rajotte-Julien
       [not found]     ` <CAPC3erkfapoZu_WM=znEyj0ch1YiKeX7-JBiauoLh+Seee0TZA@mail.gmail.com>
  0 siblings, 1 reply; 4+ messages in thread
From: Jonathan Rajotte-Julien @ 2020-05-13 15:33 UTC (permalink / raw)


Hi Abhinav,

Please refrain from using screenshots when pastebin could be used (code,
commands, etc).

On Wed, May 13, 2020 at 10:29:22AM +0530, Abhinav Ranjan via lttng-dev wrote:
>   Hello Sir,
> I am Abhinav from India.
> *Kindly Ignore the previous email.*
> Actually I am very new to the Embedded System Engineering profession. In
> fact I have been asked to do an independent project to instrumenting a c
> application using  LLTng concept to find/trace calls to malloc(), free()
> calls. In fact i tried capturing the same as below steps but didn't
> understand why after using LD_PRELOAD also malloc() and free() calls were
> not traced. I am not sure whether my app was correct!!
>
>  I followed the steps provided to create executable using -lltng-ust -ldl
> 2.I executed it as: LD_PRELOAD=liblttng-ust-libc-wrapper.so ./executable
> (initially as ./exe arg))
> 3. Then I followed commands to create , capture the events. and destroyed
> it.

Based on the screenshot "creation_trace.PNG", it seems that you enable only the
event you defined (malloc_trace_investigation). Keep in mind that the libc
wrapper defines its own tracepoints and tracepoint providers.

It the case of the libc wrapper the tracepoint providers available are:
lttng_ust_libc and lttng_ust_pthread

Both have multiple tracepoints defined under them.

Hence what you want for you experiment is something like this:

    lttng enable-event -u malloc_trace:investigation
    lttng enable-event -u 'lttng_ust_libc:*'

Keep in mind that you can list the events available for a currently running app
using:

   lttng list -u


The app must be running for the listing work.

Cheers.


^ permalink raw reply	[flat|nested] 4+ messages in thread
[parent not found: <CAPC3erkfapoZu_WM=znEyj0ch1YiKeX7-JBiauoLh+Seee0TZA@mail.gmail.com>]
* [lttng-dev] Need Help In trace generation for malloc(), free() calls etc
       [not found]     ` <CAPC3erkfapoZu_WM=znEyj0ch1YiKeX7-JBiauoLh+Seee0TZA@mail.gmail.com>
@ 2020-05-13 18:04       ` Jonathan Rajotte-Julien
  2020-05-14  5:25         ` Abhinav Ranjan
  0 siblings, 1 reply; 4+ messages in thread
From: Jonathan Rajotte-Julien @ 2020-05-13 18:04 UTC (permalink / raw)


Hi Abhinav,

Please keep the mailing list in CC for all communication: lttng-dev at lists.lttng.org

If not, I am not interested in helping you further.

On Wed, May 13, 2020 at 09:26:52PM +0530, Abhinav Ranjan wrote:
> Hi! Jonathan thank you so much for your help and reply! Sure I'll not use
> snapshot from next time and follow your advice.
> In fact I figured out the issue, but Jonathan I have one specific doubt I
> wanted to trace malloc , free call from my app only  but after using lttng
> enable-event --userspace lttng_ust_libc:malloc I am seeing several malloc (
> in Trace Compass)   probably from different tracepoints from lttng_ust_libc.

You will see all malloc that the app does for its lifetime since you LD_PRELOAD
the wrapper including any allocation lttng-ust does. Keep in mind that lttng-ust
is not magic, lttng-ust spun threads and do some allocations to do its job.

What outcome do you expect? We might be able to at least get you on the right
path. In other word, what is your end goal?

Cheers


^ permalink raw reply	[flat|nested] 4+ messages in thread
* [lttng-dev] Need Help In trace generation for malloc(), free() calls etc
  2020-05-13 18:04       ` Jonathan Rajotte-Julien
@ 2020-05-14  5:25         ` Abhinav Ranjan
  0 siblings, 0 replies; 4+ messages in thread
From: Abhinav Ranjan @ 2020-05-14  5:25 UTC (permalink / raw)


Thank You Sir,
I am sorry for the inconvenience caused to you!
Surely I'll take care of every suggestion you passed on to me.

Once again I thank you for your wonderful help!

Stay Safe and Happy!!!


On Wed, 13 May 2020 at 23:34, Jonathan Rajotte-Julien <
jonathan.rajotte-julien at efficios.com> wrote:

> Hi Abhinav,
>
> Please keep the mailing list in CC for all communication:
> lttng-dev at lists.lttng.org
>
> If not, I am not interested in helping you further.
>
> On Wed, May 13, 2020 at 09:26:52PM +0530, Abhinav Ranjan wrote:
> > Hi! Jonathan thank you so much for your help and reply! Sure I'll not use
> > snapshot from next time and follow your advice.
> > In fact I figured out the issue, but Jonathan I have one specific doubt I
> > wanted to trace malloc , free call from my app only  but after using
> lttng
> > enable-event --userspace lttng_ust_libc:malloc I am seeing several
> malloc (
> > in Trace Compass)   probably from different tracepoints from
> lttng_ust_libc.
>
> You will see all malloc that the app does for its lifetime since you
> LD_PRELOAD
> the wrapper including any allocation lttng-ust does. Keep in mind that
> lttng-ust
> is not magic, lttng-ust spun threads and do some allocations to do its job.
>
> What outcome do you expect? We might be able to at least get you on the
> right
> path. In other word, what is your end goal?
>
> Cheers
>
>

--
Thanking You!

Regards,
Abhinav
-------------- next part --------------
An HTML attachment was scrubbed...
URL: <https://lists.lttng.org/pipermail/lttng-dev/attachments/20200514/c2a37119/attachment.htm>


^ permalink raw reply	[flat|nested] 4+ messages in thread
end of thread, other threads:[~2020-05-14  5:25 UTC | newest]

Thread overview: 4+ messages (download: mbox.gz / follow: Atom feed)
-- links below jump to the message on this page --
     [not found] <CAPC3ern8bkAJDnOwoYh2Om44Q2GWAPsh140FW_aPGVkdUmCwkw@mail.gmail.com>
2020-05-13  4:59 ` [lttng-dev] Need Help In trace generation for malloc(), free() calls etc Abhinav Ranjan
2020-05-13 15:33   ` Jonathan Rajotte-Julien
     [not found]     ` <CAPC3erkfapoZu_WM=znEyj0ch1YiKeX7-JBiauoLh+Seee0TZA@mail.gmail.com>
2020-05-13 18:04       ` Jonathan Rajotte-Julien
2020-05-14  5:25         ` Abhinav Ranjan
This is a public inbox, see mirroring instructions
for how to clone and mirror all data and code used for this inbox